Geographic display of information

صفحه نمایش جغرافیایی اطلاعات

Geographical decision-making or GeoView

Obtaining a clear and comprehensive understanding of an organization’s strategic data is crucial. And when it comes to achieving simplicity, usefulness, and accessibility, nothing beats the power of geographical display. By incorporating maps into data analysis, information becomes readily available, enabling swift decision-making processes. The inclusion of the geographical dimension plays a pivotal role in modern decision-making systems, ensuring that data is easily comprehensible to all stakeholders.

Subject-oriented maps allow users to access important information precisely when and where they need it. By seamlessly integrating these maps with existing analytical programs, organizations can enhance their data management capabilities in a dynamic and interactive manner. This integration brings the benefits of a simplified and professional Geographic Information System (GIS), empowering users to effectively handle geographic data.

With this advanced capability at their disposal, organizations gain the opportunity to present a new breed of analysis. By combining data and information indicators with region-specific images such as commercial sectors, cities, villages, industrial areas, and even satellite and urban images, a comprehensive understanding of the data emerges. In other words, it can be described as a process of data mining and extraction that effortlessly delivers valuable insights through top-to-bottom infiltration, accompanied by visually impactful images.

Experience the power of geographical display, where data-driven decision-making is made accessible to everyone through intuitive maps and rich visualizations.

Incorporating geographic maps into QlikView

In many organizations, multiple branches are spread across various cities, countries, and even continents. To effectively monitor the performance of these branches, it becomes essential to have insights into their respective locations. QlikView offers a powerful map feature that allows users to visualize and analyze data in a geographical context. Similar to Google Maps, this feature displays relevant data points on the map, providing a comprehensive view of branch, city, or province-specific information.

a Chart for qlik view

Advantages and features of GeoView Component

  • Allowing users to visually analyze data on a map, providing a clear and intuitive representation of information.

    The ability to work offline, eliminating the dependency on internet connectivity.

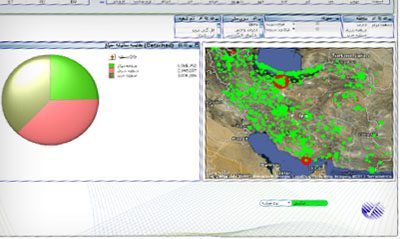
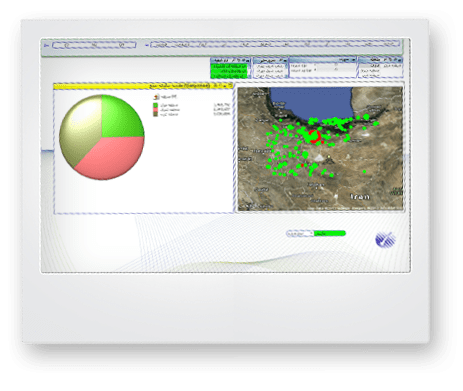
  •  Users can drill down into different levels of detail on the map, enabling zooming functionality. They can start with an overview of an entire country (e.g., Iran), then zoom in to specific areas, provinces, cities, and even streets, gaining insights at each level.

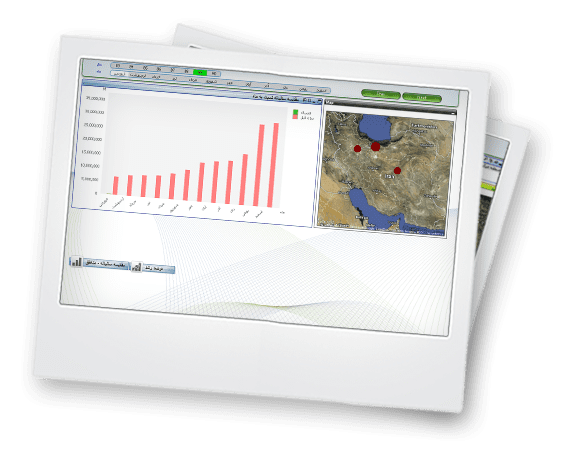
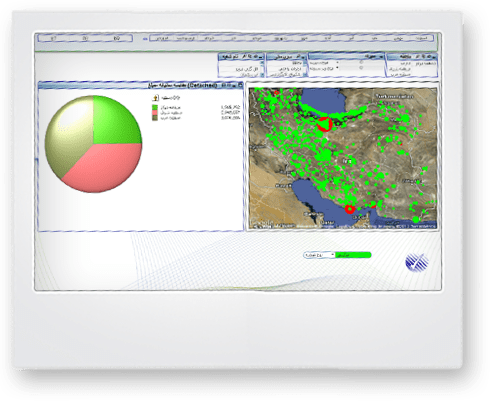
     facilitating the assessment of organizational performance across different geographical areas.

    Users can easily navigate and explore the map, moving across different locations and regions with fluidity and ease.

    offering flexibility in map modes, allowing users to switch between different views such as Map, Satellite Map, and Hybrid.

  • The GeoView Component enables users to retrieve specific data related to desired geographical points. This capability allows for targeted analysis and insights based on user-defined locations.