What is cohort analysis?
Cohort analysis, also called customer retention rate analysis, is a type of behavioral analysis in which users or customers can be grouped based on common characteristics over a certain period of time to better analyze and understand their performance. We call any group of users who perform a similar behavior in a certain period of time, a cohort.
The importance of cohort analysis
- Accurate and targeted understanding of customer behavior
- Tracking and understanding customer behavior patterns
- Identifying, acquiring and retaining valuable customers
- Helping to make more informed decisions
Steps of cohort analysis
In general, cohort analysis consists of three steps, which are named anchors for this analysis: Cohort definition anchor, delay time anchor and delivery time or end time anchor.
Cohort definition anchor: It is the moment when the competition has started and the behavior of each user or potential customer is supposed to be observed and evaluated.
Anchor delay time: In this anchorage, it is decided for how long the cohort analysis will be performed. This number is mainly chosen based on business priorities and requirements.
Finally, by defining the cohort and the delay period, it is possible to determine the final anchor, which is the end time of the analysis.
In the following, an example of cohort analysis in the banking industry will be described.
Implementation of cohort analysis in the banking industry:
Suppose a bank launches a marketing campaign every month for the lottery of Qarz Al-Hasna accounts for a period of one year, and the account opening date for customers who participate in this lottery is one month.
Suppose a customer opened an account and deposited a certain amount in his account on a certain date in response to this campaign.
As a business owner, it is probably important to ask ourselves if this customer will refer to our bank again or in other words, will he have a transaction in this bank or not, and if he returns, at what speed and at what time intervals? What value will it provide to our organization?
In this way, it is possible to identify, analyze and monitor customers who have a similar behavioral pattern at a similar point in time, and as a result, to discover and display insights from the organization that cannot be accessed through simple analysis.
Therefore, the system user or the relevant bank expert is asked to track the behavior of people like this customer and see if they will return to the bank and make a transaction in the following months, and how long these returns will take. In other words, how many of these users are transitory and temporary users and how many of them become bank customers by performing multiple transactions.
step one
The definition of a cohort is the moment when the competition to participate in the bank lottery has started by opening an account on behalf of users, and we are supposed to observe the behavior of each user who may become a bank customer.
The second step
In this step, we determine the delay period. If we want to examine customer behavior one month after our first transaction, the lag period will be one month.
The third step
In the third step, the end of the specified analysis period is calculated based on this end of the cohort analysis period. In this example, the end of the analysis period is twelve months after the first month of the campaign.
After implementing the implementation of cohort analysis using Python programming language, the results of cohort analysis (customer retention rate) have been visualized using the heatmap diagram and displayed as follows.
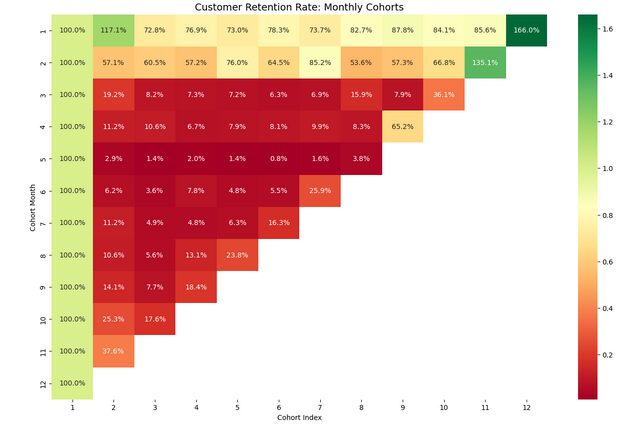
Interpretation of the cohort diagram:
The numbers displayed in each box of the heatmap represent the percentage of customers who have transferred from the previous cohort to the current cohort.
In other words, the interpretation of the points marked with the red box in the figure above is that for customers who opened an account and made a deposit transaction in the second month, the sum of the number of their deposit transactions in the 11th cohort compared to the 10th cohort is 1/ It has increased by 135%. A similar interpretation can be made for the twelfth cohort in the first month also used and claimed that the total number of customer deposit transactions in this cohort has increased by 166% compared to the previous cohort.
In general, what can be inferred from the graph and its values is that the customers who registered in the first months of the campaign are more loyal than the customers who registered in the last months of the campaign. In other words, customers in the first months of the campaign were interested in making transactions in the following months until the end of the campaign. This is despite the fact that the customers who registered in the last months of the campaign did not show interest in continuing the transaction in the following months, and the percentage of these customers’ transactions in the following months has been declining.