Tableau software

According to a 2011 IDC report, the volume of data generated worldwide in 2020 is projected to be 50 times greater than that of 2011, while information resources are expected to grow 75 times. To harness the potential of this vast amount of information and transform it into actionable insights, humanity needs a convenient means of accessing and circulating the data. This is precisely what Tableau, a software developed by Tableau Software in the United States, offers. Tableau Software specializes in business intelligence and visually interactive data display. The company was founded by Pat Hanrahan, a professor, and Chris Stolte, a PhD student, between 1997 and 2002 within the computer science department of Oxford University. With Tableau’s innovative software, users can now unlock the power of data at their fingertips.
Tableau Software, after years of expertise in data warehousing, Multi-Dimensional databases, and data visualization, has developed a groundbreaking language called VizQL (Visual Query Language). By combining the power of the standard query language (SQL) and descriptive language, this language revolutionizes data analysis.
 
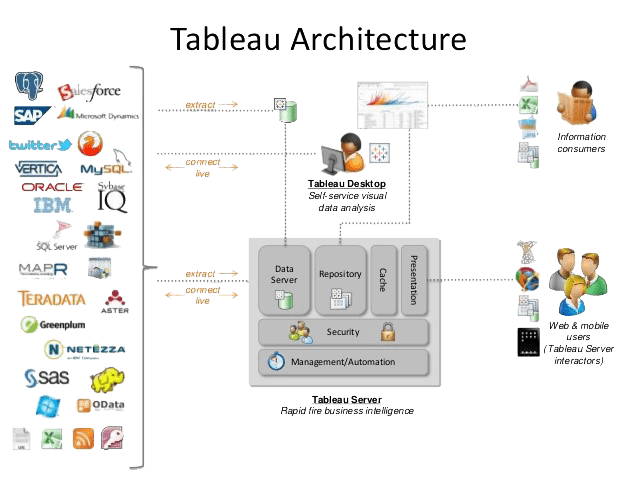
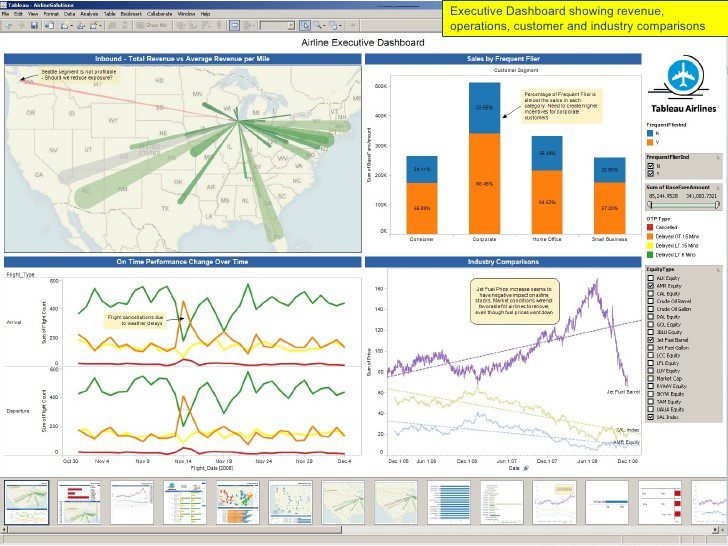
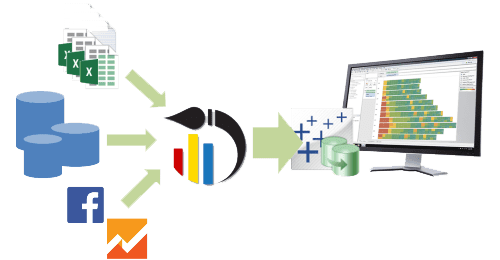
As the backbone of Tableau software, VizQL enables seamless interaction with various data sources, including relational databases, cubes, cloud databases, and spreadsheets. It empowers users to generate a wide array of graphs, reports, and management dashboards, accessible both internally within the network and on the internet.
 
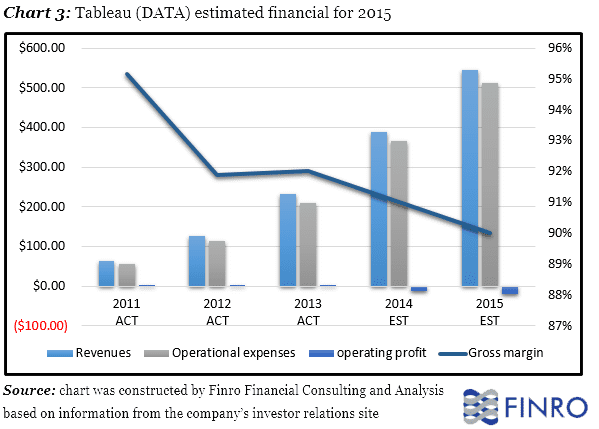
The remarkable growth of Tableau Software is evident from its financial performance. In 2010, the company recorded an income of $34.2 million, which surged to $62.4 million in 2011 and further climbed to $127.7 million in 2012. These figures clearly demonstrate the company’s rapid expansion and success in the industry.
 
  • Tableau Software has gained recognition as one of the top tools in the business intelligence category, as assessed by Gartner in 2015. The evaluation conducted by Gartner, a renowned research and advisory firm, highlights Tableau’s excellence and positions it among the best tools available for business intelligence solutions.

Different versions of Tableau business intelligence software

Tableau Desktop, built upon the success achieved at Oxford University, offers a user-friendly experience that allows users to effortlessly connect to diverse data sources and create interactive dashboards through intuitive Drag & Drop functionality. The product’s development spanned many years to ensure it captures the natural thought process of humans when designing dashboards.

Unlike complex script environments or convoluted wizards, Tableau Desktop enables users to focus on creating visually appealing and informative dashboards without getting lost in technical complexities. The software empowers users to effortlessly present data in a visually compelling manner. Its user-friendly interface is so intuitive that even Excel users can quickly grasp its functionalities.

Tableau Desktop’s efficiency is remarkable, delivering results 10 to 100 times faster than existing solutions. With minimal effort, users can achieve exceptional outcomes and derive valuable insights from their data. The software simplifies the process of data visualization, making it accessible and effective for users of all levels of expertise.

Tableau Server offers a powerful environment where analyses and dashboards can be accessed through different web browsers, eliminating the need for any programming knowledge. This allows all users within the organization to benefit from the analytics without requiring technical expertise.
 
With Tableau Server, analysts and experts can utilize interactive dashboards and conduct analyses online. They can easily share their insights with others, fostering collaboration and knowledge sharing within the organization. Additionally, the scalability of Tableau Server enables organizations to expand the number of analysts seamlessly, accommodating the growing analytical needs of the business.
 
By leveraging Tableau Server, organizations can provide an accessible and user-friendly platform for data analysis, empowering users at all levels to explore and interpret data in a meaningful way. The server environment enhances productivity, facilitates collaboration, and enables efficient utilization of analytical resources. 
Tableau online is a server version hosted by Tableau itself. In fact, there is no need to provide infrastructure inside the organization and we can easily provide the desired infrastructure in the form of hosting.
This product is for people who want to load and use data interactively in the web environment. This product is provided as a service by the company itself. The Premium version is suitable for companies that want to improve their interactive information on their website and use this environment as a service.
 

Why should we use the board?

  • Tableau’s features and the VizQL language contribute to a user-friendly and efficient data analysis and visualization experience. Here are the key points:
  1. Ease of use: Tableau prioritizes a user-friendly interface, allowing users to navigate the software effortlessly. The intuitive design facilitates easy adoption and reduces the need for extensive training.
  2. No programming knowledge required: Tableau eliminates the requirement for programming skills. Users can leverage the software’s functionalities without the need for coding, enabling a broader range of users to analyze and visualize data effectively.
  3. Focus on information creation and reporting: Tableau emphasizes the creation of compelling reports and informative visualizations. Users can concentrate on transforming their data into meaningful insights and communicating them effectively through interactive reports.
  4. Full interactive drag-and-drop environment: Tableau provides a fully interactive environment where users can perform drag-and-drop actions to manipulate and explore data. This intuitive approach allows for seamless data manipulation and facilitates the creation of visually engaging dashboards and visualizations.
  5. VizQL language revolutionizing data visualization: VizQL, Tableau’s graphical query language, revolutionizes data visualization by translating drag-and-drop actions into data queries and displaying the relevant information on the screen. This innovative language simplifies the data visualization process and enables users to quickly observe and interpret data without extensive technical training.

Advanced in-memory technology

Tableau employs in-memory technology, which enables its data engine to handle large volumes of data efficiently. This technology utilizes the computer’s memory to process data, allowing for faster and real-time reporting. With Tableau’s in-memory processing, even massive amounts of information can be analyzed and visualized within seconds. This capability empowers users to work with extensive datasets and generate real-time insights, enhancing the speed and efficiency of data analysis. The advantage of utilizing in-memory technology is that it can be implemented on regular computers, making it accessible to users without requiring specialized hardware or infrastructure.
 

Strengths of Tableau software

  1.  Speed: One of the major strengths of Tableau software is its exceptional speed in handling large datasets. It can efficiently process hundreds of millions of records and provide analytical insights within seconds. This speed is particularly advantageous in situations where quick and time-sensitive business decisions need to be made, allowing users to access and analyze data swiftly.
  2.  Ease of Use: Tableau’s user-friendly interface and interactive environment make it highly accessible and easy to use. Users can quickly learn and navigate the software without the need for programming experience. With its drag-and-drop functionality and intuitive design, individuals with Excel knowledge can leverage Tableau to create a wide range of analyses and dashboards. This ease of use empowers users to explore and visualize data effectively, regardless of their technical background.
 
  • 3. Beautiful and Dynamic Dashboards: Tableau excels in creating visually appealing and dynamic dashboards. The dashboards in Tableau’s business intelligence software are highly interactive, allowing users to explore data through various graphs, diagrams, and visually captivating images. This aesthetic presentation enhances the user experience and facilitates the discovery of new insights from the data.
  • 4. Direct Connection: Tableau offers seamless connectivity by enabling direct connections to databases, data files, cubes, and data warehouses. Users can effortlessly establish connections without the need for complex configurations. Simply selecting the desired table from the database allows users to start working with the data immediately. This streamlined connection process enhances efficiency and eliminates unnecessary hurdles in accessing and analyzing data.
 

5. Easy Publishing and Sharing: Tableau simplifies the process of publishing and sharing analyses. Once analyses and dashboards are created, users can easily share the results with others. With just a few clicks, the analyses can be published in the form of interactive dashboards, allowing other users to access and explore the insights in real-time. This streamlined publishing and sharing capability facilitate collaboration and knowledge sharing within the organization.

 
6. High Market Growth: Tableau has experienced significant growth in the market due to its distinctive features and capabilities. The software’s unique combination of speed, ease of use, interactive visualizations, and direct connectivity has contributed to its popularity. As a result, Tableau has gained a substantial market share and continues to witness a rapid growth rate. The software’s increasing adoption and market presence are a testament to its effectiveness and value in the business intelligence and analytics space.