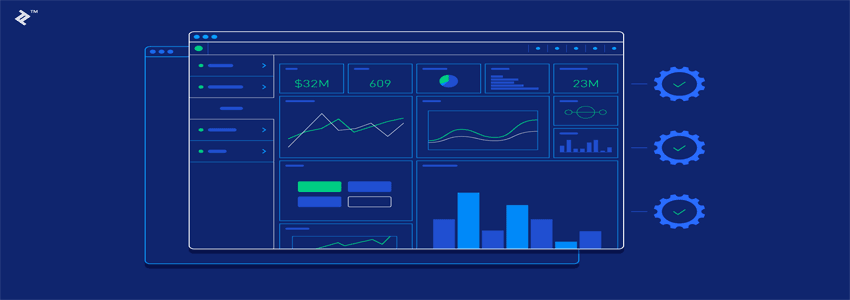
A dashboard is a graphical page of performance indicators reports that are related to the organization’s goals or its processes. The concept of the dashboard is taken from the car dashboard, which informs the driver of important situations at a glance. Dashboards have a great impact on management decisions and also warn the good or bad situation, better or worse.
The management dashboard in your business will act like a car dashboard. The amount of kilometers traveled, the temperature of the radiator water, the amount of gasoline left in the tank, the speed, the safety status, etc., is the set of information that the dashboard installed in the car will provide to its owners. All this information, despite being vital and necessary, will only act as a warning, and the success rate depends on the car owner’s decision-making and action speed.
It may seem that the dashboard of a car is just a layer of beautiful and well-designed display, but think for a moment about a car where you have no idea about its internal state, and your entire journey has to be made with guesswork, right and wrong possibilities, and decisions. Go through the blur! And this situation will definitely be unbearable.
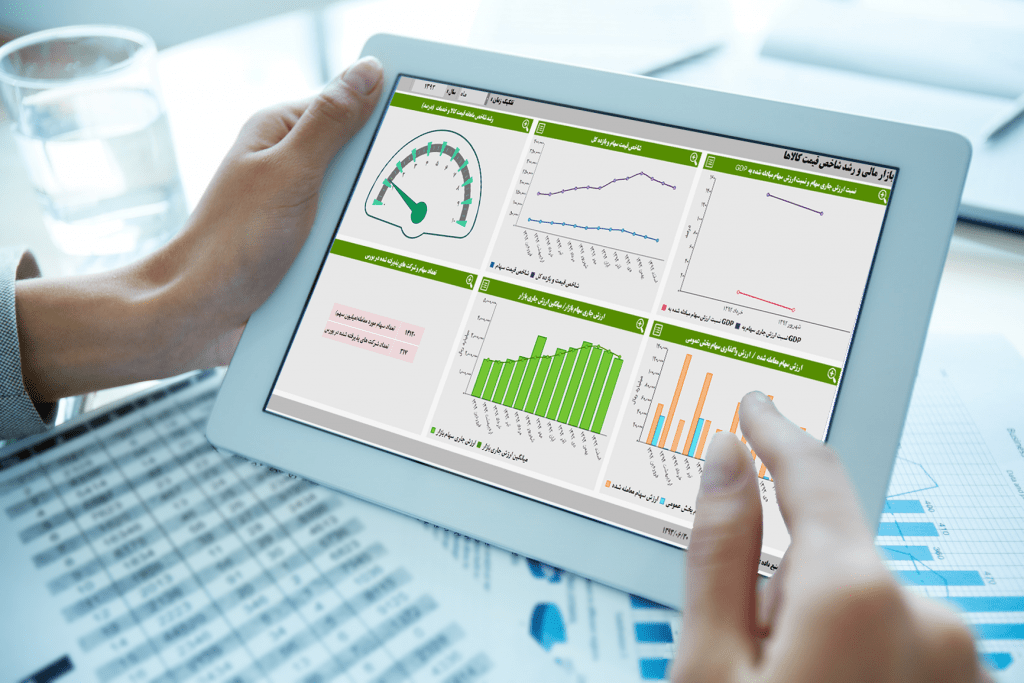
The management dashboard allows the managers of your company to view the performance of your organization at any moment and monitor its status in relation to your final goal. For this purpose, key performance indicators (KPIs: Key Performance Indicator) of the organization and units should be defined in order to be informed at any moment about the state of the company and the functions of the organizational units.

Management dashboard systems and management decision making
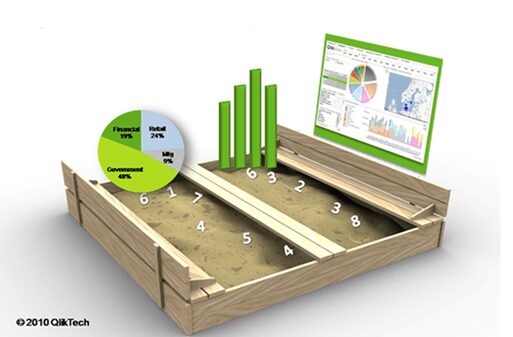
The biggest disease of an organization is the lack of accurate and timely information. Despite this fact, managers are under pressure to make decisions and are usually forced to take risks based on guesswork. These risks sometimes cause the loss of a series of business profits and interests. The business intelligence platform and management dashboard enable data management, data access and data analysis in less time and cost. This company has very valuable tools and experiences in this area, areas that cover strategic and process levels and enable the monitoring of indicators and organization easily.
Reasons for using the management dashboard
Using this system, the senior managers of the organization can easily monitor the performance indicators of their organization, department or unit in a beautiful and uncomplicated environment. Also, the main users of the dashboard spend a lot of time outside their workplace, the dashboard provides them with the possibility to remotely access the information they want.
Advantages of the management dashboard
– Defining the key performance indicators of the organization (KPI)
– Monitoring the performance of the organization and units
– Helping to make faster and better decisions
– Display the status of the entire organization at a glance
– Quick access to information from multiple sources
General stages of system design and implementation
The first phase: identifying the processes of the organization
The second phase: defining key performance indicators of the organization and units (KPI)
The third phase: designing the management dashboard system
The fourth phase: designing and implementing the software
– Solutions in this field include BI business intelligence, management dashboards, Throughput Accounting (momentary profit and loss) and integrated management reporting tools.
– These systems have the ability to connect to most of the existing sub-systems of the companies and do not apply changes in the current software and management layers.
Now, with the growth of the information technology industry and the acquisition of various experiences in the field of collecting, storing and retrieving information, the issue of “giving meaning to data” and making the decision-making process easier is at the same time in the center of attention of information technology experts and management and business science experts. Work has been done. “Business intelligence and analytical database solution” is a new technology that facilitates the decision-making process for managers after collecting, storing, cleaning, aggregating, analyzing and retrieving information. In other words, business intelligence can be thought of as a data refinery where data circulation will cause added value.
The main features of creating a management dashboard:
1) Simplify and streamline information to facilitate communication with users
2) It has minimum dispersion that does not cause confusion among users.
3) Support the organization’s business using useful data of work processes
3) Support the organization’s business using useful data of work processes
5) Eye-catching and comfortable to display the most important topics of the organization
Performance assessment indicators
Performance evaluation indicators are one of the most widely used tools in BI business intelligence. Index classification is used in different management levels of the organization. In fact, financial and non-financial measurement criteria are used to determine the quality of goals and reflect the strategic performance of an organization.
These indicators are classified into three general groups.
1) Evaluation indicators (Measures)
These indicators include the values that are used in all levels of the organization, especially the operation level. The number of these indicators depends on the field of processes and business of the organization. Practical indicators are one of these types of indicators.
2) Performance indicators – Performance Indicator (PI)
This indicator directly refers to monitoring or evaluating the performance of a specific issue in the organization, which is mainly related to business plans or goals. The users of these indicators are the managers of an organization who will use each of these indicators according to the work relationship. Financial indicators and human resources, which are mostly numerical values, belong to this group.
3) Key Performance Indicators (KPI)
This part of the key indicators is a limited number of indicators that are related to the strategic goals of the organization, or in other words, from the point of view of the senior managers of the organization, the monitoring and control of these indicators is vital for the organization. Directional indicators that show the direction of the organization are such indicators.